


Are you looking to gain deeper insights into the performance of your website on Google? Do you want to understand the search terms that are driving traffic to your site? Look no further than the Google Search Analytics Report. Google Search Console Report provides valuable data and metrics that can help you optimize your website and improve its visibility in search results. In this blog article, we will explore what the Google Analytics Queries Report is, how to access it, and how to use the data to improve your website’s visibility.
Google Analytics Search Terms Report provides valuable insights into the search queries that drive organic traffic to your website. It allows you to analyze various metrics, including clicks, impressions, click-through rate (CTR), and average position, based on the search queries used by users.
How to access the Search Queries Report Google Analytics?
- Log in to Google Search Console
- Select your website from the dashboard
- In the left-hand menu, click on “Performance.”
Now you can see the search term report google analytics. It offers several configuration options to tailor the data according to your requirements. You can choose the date range, filter results by specific pages or countries, and even compare different metrics. so let’s explore its features and benefits which can improve your website’s performance.
1. Queries:
You can see the search query report google analytics provides. The keywords or phrases that visitors searched for to reach your website are displayed by this filter. For each query, it displays the number of clicks, impressions, CTR, and average position. Use this information to determine the search phrases and keywords that are driving visitors to your website.
2. Pages:
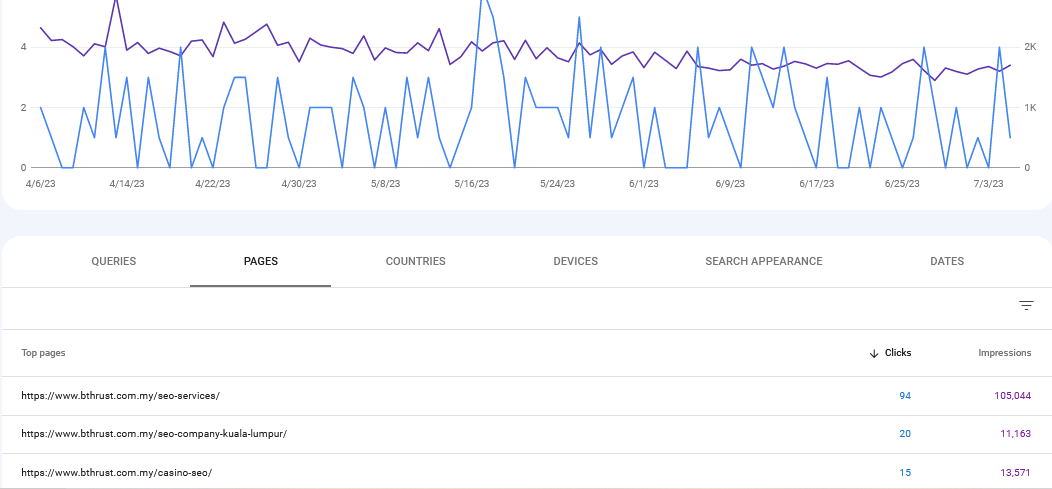
This filter offers information on how well each page of your website is performing individually. You can check which page has the highest average position, the most clicks, and the most impressions. Use this data to find your best-performing pages and improve the ones that are underperforming.
3. Countries:
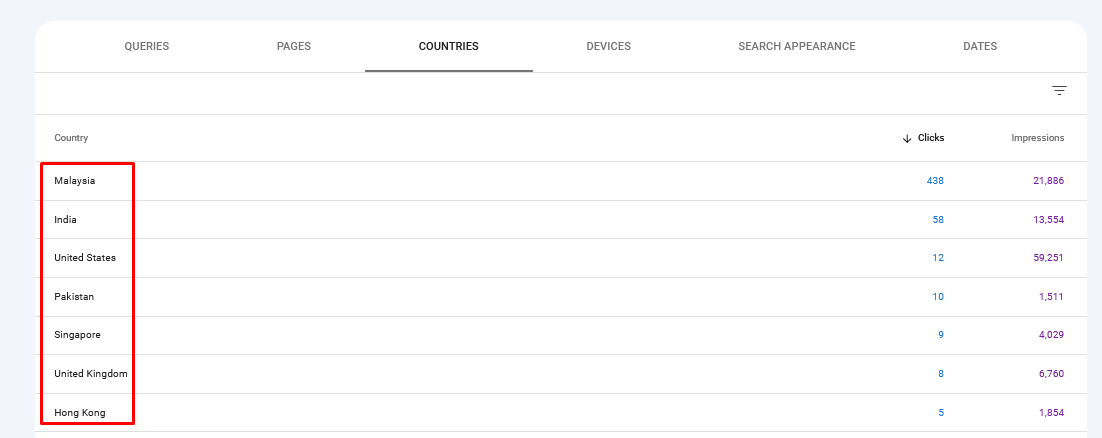
You may see how well your website is performing in other nations by using the country filter. If you have a worldwide audience and want to understand how your website is doing in certain geographical regions, this might be useful.
4. Devices:
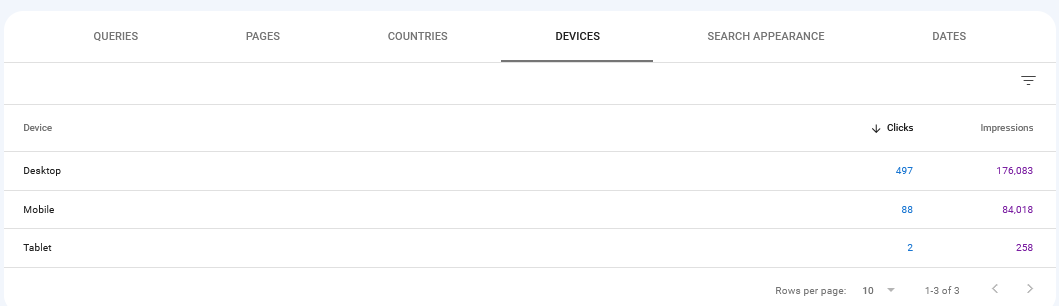
This filter offers information on how well your website performs across various platforms, including desktop, mobile, and tablet computers. You can enhance the user experience on your website by understanding how visitors interact with it on various devices.
5.Impressions:
Impressions are the number of times a user has seen your website when searching for a certain term or phrase. You can evaluate the reach and visibility of your website by tracking impressions.
6. Clicks:
The quantity of clicks indicates how frequently visitors have selected the link to your website from search results. You can measure the efficiency of your titles and meta descriptions in getting people to click over to your site by keeping track of clicks.
7. CTR (Click-Through Rate):
The CTR measures the proportion of impressions that led to a click. It enables you to evaluate the usefulness and appeal of your search snippets. Higher CTRs often mean that your site’s titles and meta descriptions are successfully attracting visitors to visit it.
8.Position:
The position evaluates your website’s typical position among the search results for a given query. It offers you an overview of how well your website is performing and enables you to spot areas that might have been better.
How you can utilize these insights?
- Identify top-performing keywords: Focus on optimizing your content for high-performing keywords to attract more organic traffic.
- Optimize underperforming pages: Identify pages with low CTR and average position. Improve the meta titles, meta descriptions, and content of these pages to make them relevant to users.
- Monitor trends and seasonality: Analyze your website’s performance over time to identify any recurring trends or seasonal patterns. This data can help you to plan future strategies.
- Mobile optimization: Ensure that your website is mobile-friendly. With the increasing use of mobile devices, a well-optimized website for mobile is a must.
- Target specific countries: If you are getting some significant users from specific countries, plan your SEO strategies to cater to the preferences and needs of users in those countries.
- Track Progress: Regularly monitor the performance of your website. Look for improvements in impressions, clicks, and click-through rates to improve the effectiveness of your SEO efforts.
Conclusion
The Google Search Analytics Report is a valuable tool for understanding how your website performs in organic search results. By analyzing the data provided in the Google search console report and making informed optimizations, you can improve your website’s performance. So, make use of this effective tool to maximize the visibility of your website on Google and grow your business.